Daily Leverage Certificates
DLC Hotline: (65) 6226 2828
Market Commentary (Hong Kong)
For the week ending 5 April 2024
Brent Crude and WTI made new year-to-date highs while the Dow fell to a three-week low. Yield of the US 10-year Treasury Bond made a new year-to-date high of 4.429% and closed the week at 4.404%.
● Fitch Ratings downgraded China’s second largest property developer Longfor Group to ‘BB+’.
● The World Bank published a new global ranking of GDP by Purchasing Power Parity. Russia approaches Japan which is in fourth place while Indonesia overtook Germany to become sixth-placed.
● Worst earthquake in 25 years to hit Taiwan could disrupt global electronics supply. TSMC had to evacuate factory areas; it will diversify production to new plants in the US, Japan and Germany.
● China sees a surge in orders for sporting goods and accessories as the Paris Olympic 2024 draws near.
● BYD plans to introduce a new mid- to large-sized electric pickup truck for global markets; could take a bite of Tesla’s Cybertruck market.
Hang Seng Index closed this week at 16724. up 183 points or 1.1%. The index closed below the 17000 level overhead although intra-week breached this level slightly. A 150-Day SMA (yellow) is also in the vicinity so both elements could be potential resistance. Despite appearing to be capped by these elements, this week’s price action jumped above last week’s candle and left a gap behind. This combination suggests that there could be strength in this week’s action right up to the close with the uncovered gap.
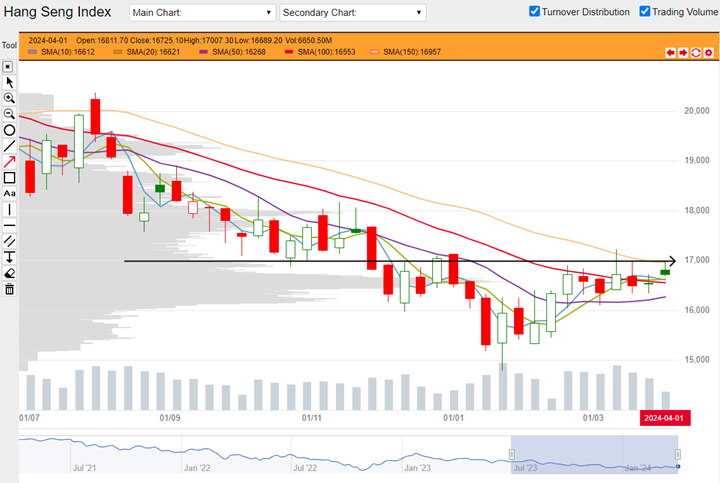
HSI weekly chart from 02 January 2023 to 5 April 2024 (Source: DLC.socgen.com)
Hang Seng Tech closed the week at 3451, down 27 points or 0.77%. HSTech continues to react and to be capped by the 100-Day SMA (red) overhead. This is a potential resistance that has precedence (see both circles). HSTech’s close is decidedly more bearish than the HSI. While the latter gapped up and closed high with an uncovered gap, HSTech’s close engulfed the body of last week’s candle. HSTech could be setting more for a continuation of the previous downtrend with its sequence of lower-low and now potentially lower-high.
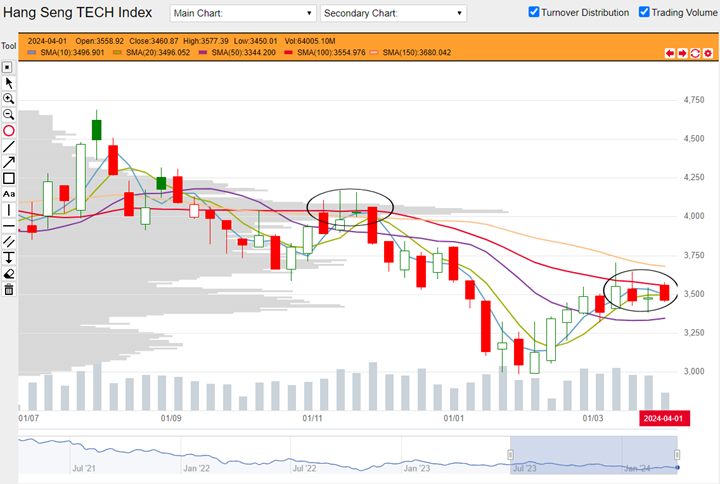
HSTech weekly chart from 02 January 2023 to 5 April 2024 (Source: DLC.socgen.com)
The Dow had its worst week since the end of October last year. It closed at a three-week low of 38904 and was down 2.27%. The Dow sits on its 50-Day SMA. Nasdaq was down 0.80%.
The next FOMC meeting is scheduled on 01 May 2024.
Fed funds futures on rate hike probability by next Fed meeting as at this week’s close:
● 95.2% probability of no change |4.8% probability of 25 basis points cut
Fed funds futures on rate hike probability by next Fed meeting at last week’s close:
● 95.8% probability of no change |4.2% probability of 25 basis points cut
Probabilities on the CME Fedwatch Tool indicate no more rate hikes for this year but also indicate possibility for rates to stay at current level until April next year. Probabilities predict up to 150 basis points cut for the whole of 2024 and up to 200 basis points between now till April 2025.
Shanghai closed this week at 3069, up 28 points or 0.92%. Shenzhen closed the week at 9545. up 144 points or 1.53%. Both indices closed above their 10- and 20- Day SMAs. This is a short week for China’s markets as they are closed for the Qingming Festival.
Other news:
● AIA, Kuaishou, Tencent, Wuxi Biologics and Xiaomi bought back shares.
● AAC Technologies, CNOOC, PetroChina and Xiaomi printed new 52-week highs. Sunny Optical, Wuxi Bio and XPeng printed new 52-week lows.
● UBTech Robotics will use Baidu’s Ernie Bot in its humanoid robots. UBTech will train its robots to be part of its EV manufacturing process.
Technical observations
JD.com 9618.hk clear ascent to higher range, reversal could be taking place.
Note chart features:
1. JD.com demonstrated clear boundaries in its previous consolidations. As can be seen the weekly chart below, there were two previous consolidations. The first from mid-October 2023 to early-January (rectangle on left) this year showed clear boundaries from highest end-of-week close at $112.50 to lowest end-of-week close at $96.65. Its second consolidation (rectangle at bottom right) from January this year till five weeks ago had its highest end-of-week close at $95.75. We can see that the high or resistance of the second consolidation was the low of the first.
2. A number of potential price action could be anticipated but has to be verified. First, it is possible that the high of the first consolidation at around $112.50 could come back in the form of potential resistance. Second, it is possible that the high of the second consolidation around $95.75 could come back as some form of potential support for the current range.
3. If the second consolidation acts as a floor for JD.com in the near future, JD.com could potentially trade in a higher-high and higher-low range. This kind of price action qualifies as a bullish reversal pattern.
4. Moving averages are still trending down. Since they are lagging, they could take time to reverse. It is also possible that the current move is merely a retracement in a downtrending setup. Volume in the past four weeks was diminishing. Some form of retracement to look for a floor is possible without more volume to drive gains.
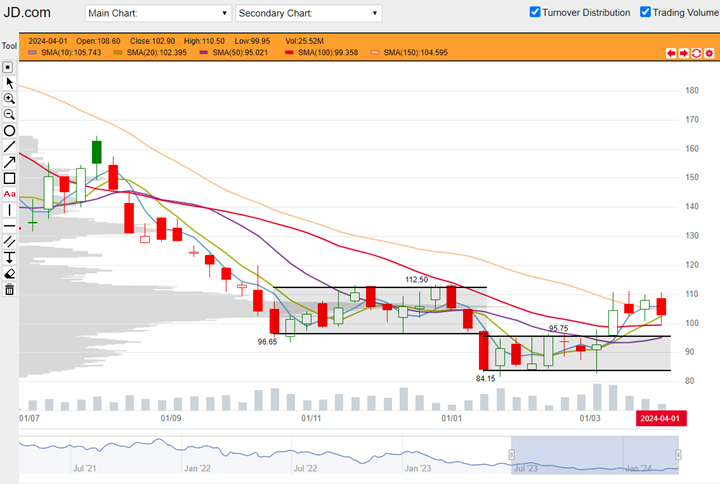
JD.com 9618.hk weekly chart from 02 January 2023 to 5 April 2024. (Source: DLC.socgen.com)
Underlying Index/Stock |
Underlying Chg (%)1 |
Long DLC (Bid Change%2) |
Short DLC (Bid Change%2) |
|---|---|---|---|
| Hang Seng Index (HSI) | -0.90% | ECSW (-4.89%) | CZRW (+6.09%) |
| Hang Seng TECH Index (HSTECH) | -1.29% | UQTW (-9.39%) | CVYW (+14.73%) |
| JD.com (9618.HK) | -0.32% | 8E9W (-0.06%) | VPYW (+1.96%) |
Brought to you by SG DLC Team
This advertisement has not been reviewed by the Monetary Authority of Singapore. This advertisement is distributed by Société Générale, Singapore Branch. This advertisement does not form part of any offer or invitation to buy or sell any daily leverage certificates (the “DLCs”), and nothing herein should be considered as financial advice or recommendation. The price may rise and fall in value rapidly and holders may lose all of their investment. Any past performance is not indicative of future performance. Investments in DLCs carry significant risks, please see dlc.socgen.com for further information and relevant risks. The DLCs are for specified investment products (SIP) qualified investors only.
Full Disclaimer - here